| DROUGHT/RAIN CYCLES |
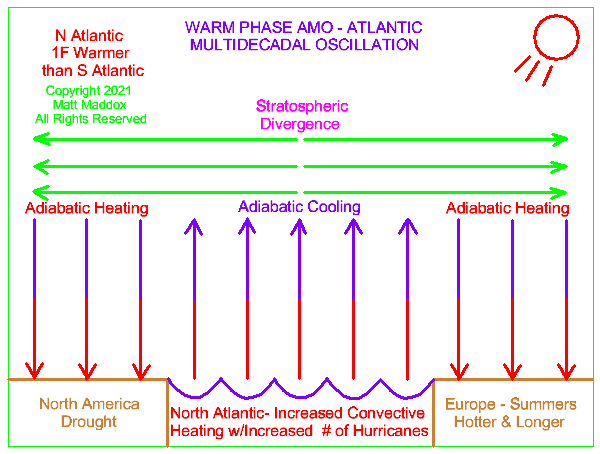
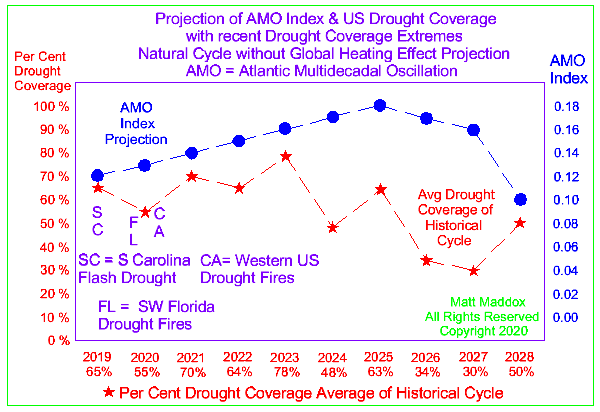
AMO - Climate Driver - is Triggering N American Drought Seven Year Drought Predicted for US - 2019-2026 Predicted Peaks for AMO - 2023 & 2025 AMO = Atlantic Multidecadal Oscillation
Uploaded 2022-05-28, Edited 2022-07-10; 2022-08-24; 2022-10-01; 2022-10-18; 2022-12-12
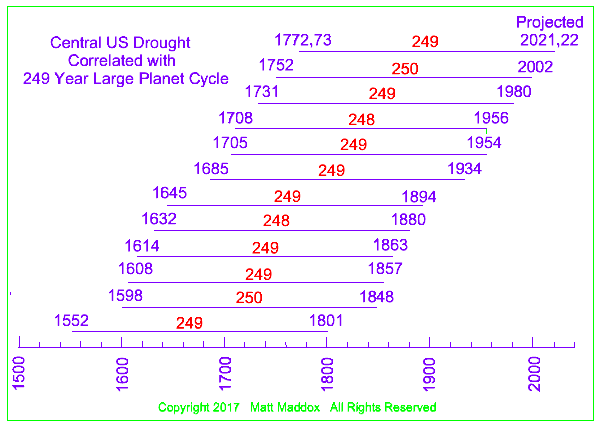
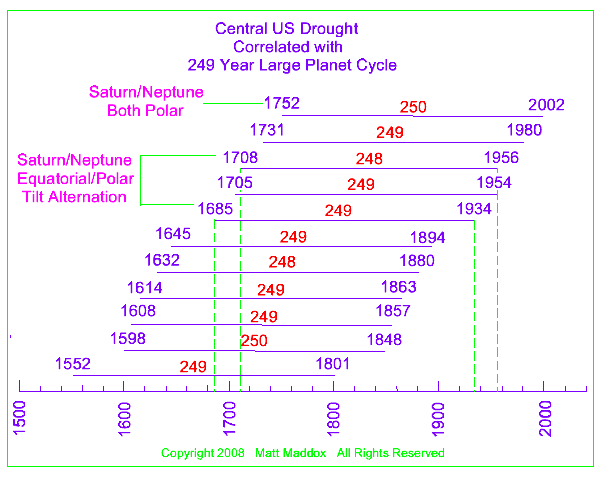
249-year Central US Drought Cycle For this study central US is defined as longitudinal middle 1/3 of the US. This includes the Great Plains. Drought is defined as 80% or more of the defined area showing yellow, orange, red or brown on the Palmer Drought Severity Index (PDSI) maps for that year. The NOAA paleo pdsi maps were used for the drought determinations. After this study was completed the maps were no longer available, but the data is.
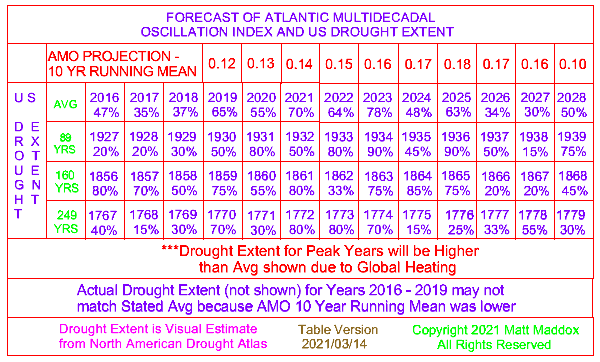
Table uploaded 2019/11/26 2300 UTC, Edited 2021/03/15 Seven Year Drought Predicted for US 2019 - 2026
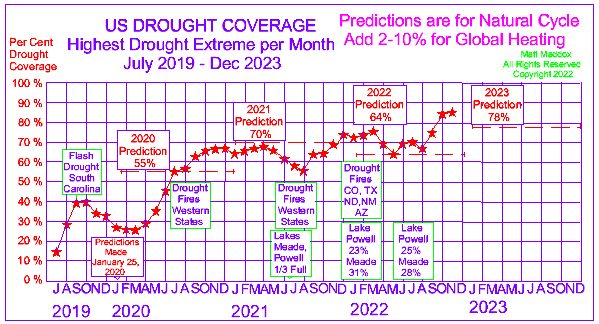
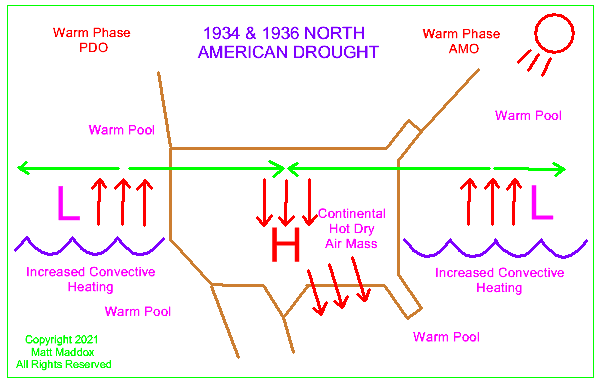
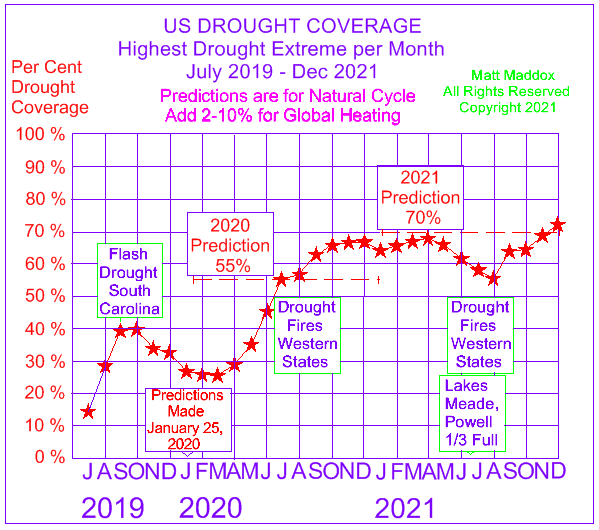
A seven-year drought is predicted for 2019-2026 for the United States. An alternate wet/dry pattern for the US was predicted at the beginning of 2019. This prediction was fulfilled starting in July 2019. Please reference https://droughtmonitor.unl.edu/Maps/MapArchive.aspx and start browsing in July 2019. The seven years should continue through the first half of 2026. It should gradually increase to include most of North America - S Canada to Central Mexico. Due to global warming the PDSI drought values shown on the North American Drought Atlas https://iridl.ldeo.columbia.edu/SOURCES/.LDEO/.TRL/.NADA2004/.pdsi-atlas.html for a given vertical series shown above will be intensified due to global warming. Please view the 1934 drought map on the NADA site referenced above. Whereas the 1934 map shows a 20-25% red zone for the US, there will be a red zone of about 60% in 2023. The average drought value for the 2016 series is 47%. Why wasn't there a significant drought in 2016? The Atlantic Multidecadal Oscillation (AMO) was in the cool phase. Soon after the AMO turned positive (warm phase) in 2019, the triple zone drought started.
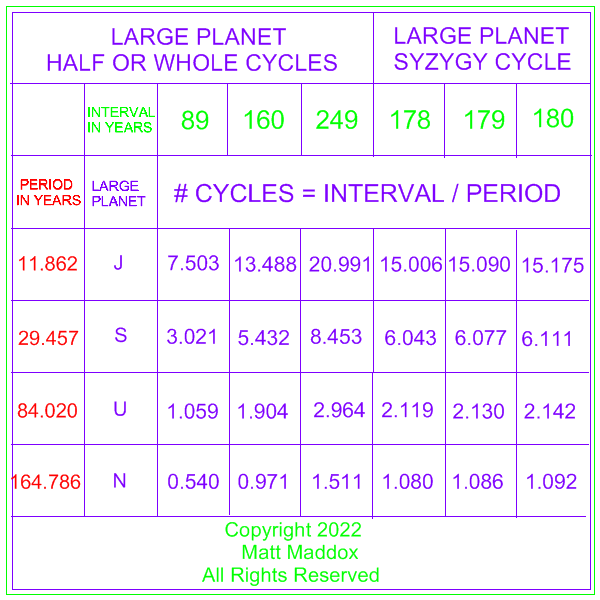
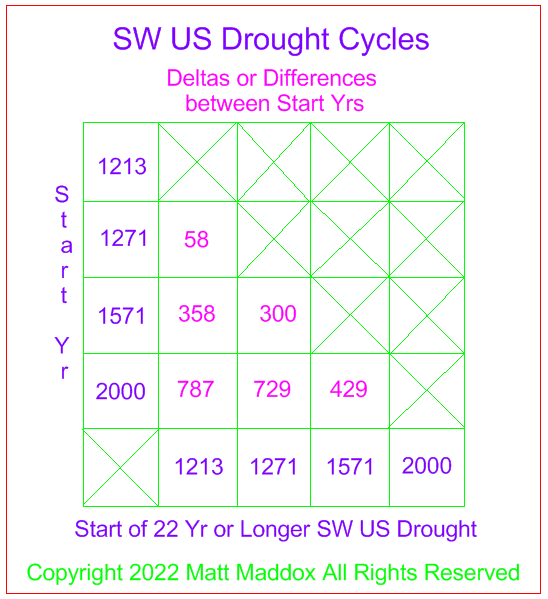
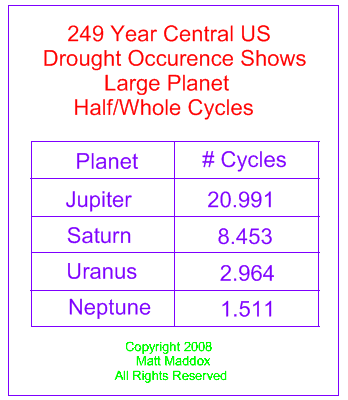
Uploaded 2022-07-10 Please note the deltas or differences between long drought occurences can be broken down into large planet cycles listed above. A good example would be the 429 yr delta for 1571 and 2000. The 429 yr delta can be broken down into 249 and 180 yr increments. The one exception to this trend is the 300 yr delta for 1271 and 1571. Note that the syzygy cycle listed above does not have to include a grand alignment at the start and end of the cycle. A given configuration of large planets at the start of this 180 yr cycle would be repeated 180 years later with an offset of ~0.1 cycles per planet or about 36 degrees. Calculation for this would be 0.1 cycle X 360 degrees = 36 degrees.
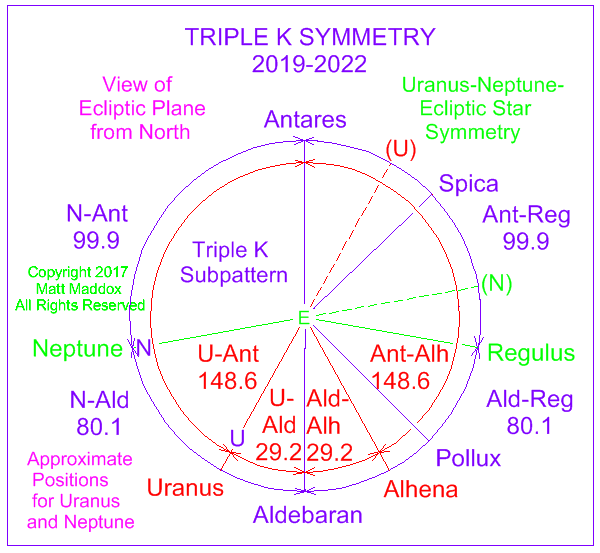
2019-2022 TRIPLE K SYMMETRY Uranus-Neptune-Star Geometric Pattern will set up crop losses From June through September 2019, then from April 2020 through May 2022, the Uranus-Neptune-Star Triple K Symmetry will have an amplification effect on worldwide climate. Areas that are dry will experience heavy drought and areas with rain will have excessive rain with numerous wet areas experiencing floods. To get an idea how this would affect the US, simply view the Columbia University NADA website and select the years 1770-1774. Then add 249 to the year being viewed and the US should have climate similiar to that year. 1770 plus 249 equals 2019. With the amplification effect discussed above, there should be extreme crop losses due to both heavy drought and excess rain. The same should be true for 2020, but with a change in the jet stream. Based on 1772-3, there should be nationwide drought in 2021 & 2022. Although the U-N-Star Triple K symmetry breaks up in May 2022, the drought pattern, with the jet stream in Mexico, will persist through the end of 2026.
intrasite links tropical storms tornadoes solar system
climate/el nino/la nina nuclear power outage/aviation accidents earthquakes/clear air turbulence
249 year central us drought cycle
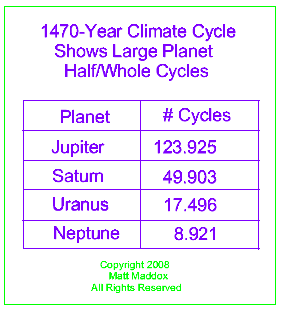
1470-year climate cycle (1) shows large planet half/whole cycles (1) www.ncpa.org/pub/st/st279 p5-6 the physical evidence of earth's unstoppable 1500-year climate cycle, s fred singer, dennis t avery, article from book by authors, ncpa policy report no. 279, sept 2005, isbn #1-56808-149-9, national center for policy analysis, dallas, tx, authors reference this author/article: gerard bond et al., “a pervasive millennial-scale cycle in north atlantic holocene and glacial climates,” science, vol. 278, no. 5341, november 14, 1997, pages 1257–1266.
Edited 2021/04/25; 2021/05/16; 2021/05/29; 2021/12/13
|
copyright 2007astrosymm
all rights resrved